
Overview
Ellsworth Medical Clinic is a family medicine practice in Wisconsin within a network of three sites and 22 providers working under the umbrella organization, River Falls-Ellsworth-Spring Valley Medical Clinics. Although the blood pressure improvement project involved the entire umbrella organization, this case study focuses primarily on activities at the Ellsworth Medical Clinic.
CDS Strategy Presented within Simplified CDS/QI Worksheet
The quality improvement (QI) project for better blood pressure control began in 2007 and was significantly enhanced in 2010 when the clinic implemented an electronic health record (EHR). The EHR allowed Ellsworth to efficiently examine key clinical data (e.g., blood pressures above the target threshold).
Improvement Target
Target
Achieve better blood pressure control in all patients with blood pressure 140/90 or greater
Target Measure
- The target measure for the QI effort was the percent of patients 18-75 with IVD, DM, and HTN, with a blood pressure consistently <140/90 when taken at the clinic.
- The target was based on goals established by MNCM, which were in turn based on guidelines developed by the Institute for Clinical Systems Improvement (ICSI). MNCM publically reports and compares provider performance on this measure annually. Since Ellsworth was a member of the ICSI, the clinic implemented ICSI guidelines/targets and reported performance to MNCM.
Improvement Goal
Ellsworth’s goal was to reduce blood pressure readings across its entire patient population such that blood pressure readings taken at the clinic were consistently less than 140/90. While the clinic recognized that expecting all patients achieve this milestone may have been unrealistic, it intended to have as many of them as appropriate achieve this goal.
- DM patients: The goal was to increase the percentage of patients with blood pressure readings of less than 140/90 to 85% (from 2007 baseline of 73%).
- IVD/HTN patients: The goal was to increase to 90% (from 2007 baseline of 68%).
QI Setup and Approach
The improvement approach was driven by a shift from looking at poor blood pressure control as only a “physician’s problem” and instead viewing it as an opportunity to team with all clinical staff to support patient health. As such, Ellsworth clinicians worked with the quality leadership team that spans all 3 sister clinics to establish common blood pressure goals and strategies.
Drivers
Ellsworth and its sister clinics had a quality leadership team responsible for examining care delivery processes and outcomes that were reported to state and national QI organizations. The quality leadership team’s participation in the ICSI QI effort prompted and provided the context for the clinics’ initiation of the blood pressure control project. Blood pressure was identified as a focus area after it became clear there was an opportunity to move beyond simply ‘good’ blood pressure control to levels that could help transform the organizational culture to one of delivering the best care possible.
QI Team
Ellsworth team members understood the financial benefit of increased reimbursement would be shared with everyone if the blood pressure readings improved. This amplified support and mobilized the team in support of the blood pressure control project. To keep staff engaged, Ellsworth used its monthly staff meetings to review patient data and intervention results.
QI Tools and Partners
Ellsworth used Institute for Healthcare Improvement (IHI) tools. For example, they used process maps and Plan, Do, Study, Act (PDSA) cycles to document and manage their quality work.
QI Approach to Target
Consensus Building
- The Ellsworth team agreed that a core goal of the blood pressure control project was to empower everyone in the clinic to improve care delivery and outcomes, which was a significant refinement of the clinic’s prior patient management philosophy. To help realize this vision, everyone agreed to take responsibility for blood pressure improvement and do something differently from what they had done previously. The first step was that they agreed physicians had to share responsibility for certain patient care processes along with other team members.
- The team summarized this new approach as follows: ‘My patients are my partner’s patients,’ ‘My partner’s patients are my patients,’ and ‘Every visit is a hypertension visit.’
- Ellsworth developed policies and procedures to enable this new shared responsibility approach. They were focused on facilitating coordinated, consistent care such that each member of the Ellsworth team was able to function at their highest capabilities allowable under their licenses; for example, having non-provider staff properly communicate test result, pre-visit planning tasks, and blood pressure measurement.
Population Management
Population management was a key focus area and was most directly supported by the care coordinators and medical assistants that helped the team design and execute workflow redesign. The care coordinators reviewed blood pressure and other related activities for patients in the practice using the EHR-enabled registry. They then discussed their findings with the team of providers and medical assistants to develop an action plan for every patient with blood pressure above the threshold.
- Ellsworth’s EHR-enabled registry was a critical tool that enabled clinicians and staff to rapidly identify all patients not meeting healthcare goals and to plan corrective action. This process was previously manual with the clinic conducing it only 1-2 times a year. The EHR allowed Ellsworth to conduct this activity on a monthly basis.
- During the monthly reviews, care coordinators pulled patient lists for each physician and identified them as IVD, DM or HTN patients. The list highlighted items that need to be addressed such as blood pressure, lab values, tobacco and aspirin status, and HbA1c for diabetes patients. Care coordinators identified specific patients who did not meet one or more goals and risk-stratified patients as low, medium or high based on their individual results.
- The team proactively reached out to patients whose blood pressure was not in control and engaged in a vigorous pre-visit planning process. For example, care coordinators contacted patients by phone to discuss their elevated blood pressure and help them identify things they could do to decrease their readings (e.g., physical activities the patient enjoys). Ellsworth also used a recall system that generated a reminder when a patient needed follow-up visit or labs.
- Once care coordinators reached out to a patient and worked with them on setting goals, accountability and self-management, they created a care plan in the EHR that incorporated patient goals and the supporting action plan. From this point on, the care coordinators leverage their training in motivational interviewing and behavioral activation to actively support their patients’ efforts by offering various tools (e.g., patient education on activity and weight loss, blood pressure documentation cards).
- The care coordinators and providers focused mostly on patients closer to optimal control, such as individuals with 3 of 4 items controlled (e.g., HbA1c, tobacco, aspirin). They found that patients who were controlled in most areas were more likely to achieve their remaining goals because they were typically more motivated and ready to make needed changes. Clinically it is in the patient’s best interest to achieve all the goals, i.e. more likely to reduce the chance of having a heart attack or stroke.
Within a Patient Visit
- Ellsworth team members entered the data at each patient visit into the EHR. Vital signs and chief complaint were documented including blood pressure, height, weight, and body mass index (BMI). If a patient’s blood pressure or BMI was abnormal, providers reviewed and discussed the data with the patient and offered tips on healthy lifestyle changes or medication if needed. Explaining the treatment options and offering education was vital in shared decision making.
- Ellsworth asked patients with a blood pressure reading of 140/90 or greater to stay and have their blood pressure rechecked in 15 minutes. A red “Recheck BP” magnet was placed outside the door as an alert. If the blood pressure remained elevated outside the target range when it was rechecked, the patient was asked to return in 1-2 weeks for another blood pressure check by the medical assistant. If at that time the blood pressure was still elevated, the patient was referred to the care coordinators who then provided additional support, based on established protocols for blood pressure management. This may have included reviewing the patient record for possible causes, notifying the provider about elevation, and/or referring the patient to the RN care coordinator for possible protocol-driven medication titration.
- Medical assistants placed standing orders for chronic diseases to get patients into the clinic in a timely manner with the appropriate testing already done so the physician had the needed data for key decisions on the day the patient was seen.
- A “Return to Clinic” order was placed for follow up visits or lab. This order was included on the After Visit Summary to help ensure patients understood the follow-up plan.
Staff Training and Collaboration
- Staff training sessions were held on the goals for optimal risk reduction for DM and IVD patients, including blood pressure control. The blood pressure recheck protocol was introduced and explained as a way to improve patients’ blood pressure control. The blood pressure magnet process was introduced with training provided on how to accurately check blood pressure. Staff was instructed on how to use patient education tools and pre-visit planning processes. This training was repeated several times throughout the initial blood pressure QI project phase.
- The care coordinators attended classes on motivational interviewing and behavioral activation. They had monthly meetings with a certified life coach who worked with them to practice techniques for talking with patients on the phone in a way that gave the care coordinators confidence in helping patients set goals.
- Training and other QI activities occurred at the monthly staff meetings, where the team’s ideas and capabilities were leveraged. Staff discussed QI processes, policies and results and barriers to implementing improvements and achieving goals (e.g., uncovering and correcting reasons why pre-visit planning was not completed at all visits). Ellsworth had a certified diabetes educator on staff who came 1 day a week and worked to augment patient education and engagement efforts. In 2012, over 85% of the diabetic patients seen at the Ellsworth clinic had seen the diabetic educator at least one time in person.
Details about Specific Clinical Decision Support Interventions
The decision support intervention strategy used both ‘low tech’ and ‘high tech’ methods.
- For example, a low tech protocol was implemented whereby medical assistants who were responsible for taking blood pressure when rooming patients placed a red “Recheck BP” magnet outside the door of any patient whose blood pressure was 140/90 or above. This kept blood pressure readings at the forefront of every visit.
- Another example of low tech was EHR-enabled protocols and standing orders that allowed care coordinators and medical assistants to help ensure that needed lab tests were completed and medications were titrated to achieve goals.
- As an example of high tech, IT staff created a report using an EHR query that the care coordinators used to proactively reach out to patients who have blood pressure outside the target range.
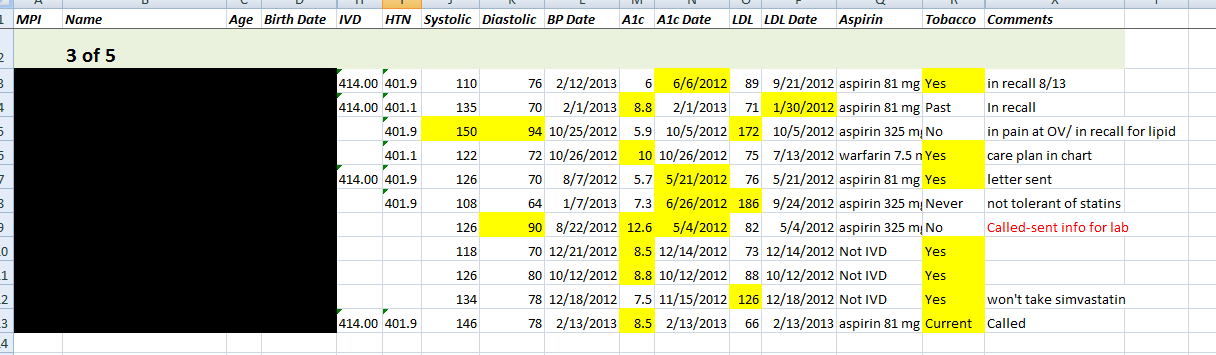
Registry
- Ellsworth developed the registry using data export capabilities from their EHR vendor. Data for each disease entity was extracted from the EHR by the computer programmer (a part time contracted service) every 3 months and transferred to a spreadsheet for sorting into patient lists.
- Ellsworth care coordinators used the registry to validate and refine the lists until they contained all the data needed in an easy to use format. The lists included information such as each patient’s 4 or 5 disease management goals and status, primary provider, and last visit date.
- The programmer updated the algorithm that created the patient lists as needed based on changing criteria (e.g., new target thresholds, age ranges) under direction from the clinical staff.
- Electronic copies of patient lists were shared among users via the clinic’s computer network.
Figure: Segment of a patient list generated from registry (included with permission from Ellsworth Medical Clinic)
Return to Clinic (RTC) Orders and Recall Process
Ellsworth staff could query the EHR to determine if a particular patient that needed follow-up had been (or would be) sent a visit reminder, and if not, they then could place the return to clinic order to set the recall process in place. At each patient visit, the provider, medical assistant, and care coordinator determined whether the patient needed a follow-up visit (e.g., for blood pressure check).
Order Sets
Order sets, which included RTC orders, helped ensure that all required lab tests, follow up visits, and other interventions were consistently and easily ordered during each visit. Providers customized their own order sets, which eliminated the need to sort through all the lab possibilities, saved significant time in generating orders, and prompted for potentially needed tests.
Patient Education
The EHR had patient education resources available that could be accessed at the same time the after visit summary was being completed. The clinic revised many patient education tools and saved them into favorites folders that could then be used by providers and staff. Each provider could select and customize the patient education material based on patient needs and goals.
After Visit Summary (AVS)
Providers used the after-visit summary to engage and motivate patients on their care plans. These summaries included information such as the patient’s medications, follow up/future appointments, problem list and services provided during the visit. Patient-specific goals and instructions could also be included (e.g., lifestyle changes such as distance goals for daily walks). RTC orders were included on the AVS as a reminder to patients about follow-up appointments after they returned home.
Patient Portal
Patients were encouraged and assisted in signing up for the patient portal in the EHR, which allowed them to receive lab results and follow up recommendations via the portal. They could access information related to immunizations, office visits, problem list and allergies, and could also contact message center staff with questions and request appointments. Currently, the practice is working on the process for sending patient reminders and conducting electronic visits (‘e-visits’) via the portal. The e-visits module will include a feature that allows patients to complete health forms that will automatically interface into the patient’s EHR record, thereby allowing a more efficient process when patients arrive for their visits.
Results
- As of December 2012, over 90% of all Ellsworth patients diagnosed with hypertension (HTN), diabetes (DM), ischemic vascular disease (IVD), or stroke have their blood pressure controlled to within the target range (<140/90).
- Blood pressure control rates increased significantly in targeted Ellsworth subpopulations:
- Among patients with DM, the percent of which have blood pressure controlled to within the target range increased from 73% in 2007 to 97% in 2011 based on data submitted to Minnesota Community Measurement (MNCM).
- Among Ellsworth patients with IVD, blood pressure controlled to within the target increased from 68% in 2007 to 97% in 2011 based on data submitted to MNCM. This result was maintained in 2012.
Next Steps
- Ellsworth is currently developing a database for DM and IVD patients that will be accessible to the provider and medical assistants in the patient exam room. This database will highlight clinical data needing attention during the patient visit, thereby supplementing the population management meetings where similar information is discussed.
- Ellsworth began rolling out more aggressive approaches to medication management. This includes teamwork between the care coordinator, RN care coordinator and mid-level providers in managing medication titration for HTN as well as elevated lipids and tobacco use.
- The clinic is aggressively flow charting the current recall/reminder process to identify barriers and improvement opportunities.
Key Lessons
- Foster communication. All Ellsworth providers shared an office, which created daily opportunities to talk and brainstorm. Providers also shared a lunch table with the staff, which promoted open and informal communications where challenges identified by team members could be addressed.
- Engage staff in such a way that makes projects a team effort. This requires each person to look for ways to make sure patients are at goal and that no patients ‘slip through the cracks.’
- Ensure that everyone functions at the fullest level allowable under their license and expertise.
- Shift to a population management mindset.
- Develop a care coordination program that helps providers and medical assistants manage patient populations outside of clinic visits. Care coordinators provide patient support over the phone and encourage patients to achieve care plan goals.
- Work with the EHR vendor on registry development and patient recall.
- Draw from the full spectrum of options – from low tech to high tech – in assembling your package of QI approaches.