
Overview
Community Health Centers, Inc. (CHC, Inc.) is a medical practice comprised of 4 urban community health centers in Utah. CHC, Inc., via its four health centers, developed a plan to leverage its electronic health record (EHR) and Clinical Decision Support (CDS) approaches to improve care for diabetic patients and improve the blood pressure (BP) target.
CHC, Inc. formed a Quality Improvement (QI) Team and applied a systematic approach to:
- Select an improvement target
- Engage stakeholders in the QI process
- Learn about improvement options
- Examine workflow and information flow related to the target
- Select and develop appropriate tools and CDS interventions
- Redesign workflow to address improvement opportunities
Improvement Target
Target
Improve blood pressure (BP) control in patients with Type 2 Diabetes Mellitus (DM)
Target Selection
- CHC, Inc. participates in a Beacon Community that is leveraging EHRs and health information technology to improve care for diabetic patients. The practice cares for many diabetic patients and noted that hypertension (HTN) control within this population is a challenging but important goal because high BP increases risks for heart attacks, strokes and other dangerous events.
- CHC, Inc. examined its data on BP control in diabetic patients and found that performance on the pertinent clinical quality measure in 2011 was at 63%, significantly below the community benchmark of 73%.
Target Measure
Percent of all patients with Type 2 diabetes with BP<140/90 (NQF 0061)
Improvement Goal
Increase performance on target measure to 73% within one year
Quality Improvement Setup and Approach
Drivers
CHC, Inc. was charged by the Beacon Community Project and their Board of Directors to better improve and document care quality. This charge was reinforced by emerging meaningful use QI requirements and recognition that the practice must prepare for increasing emphasis on quality-based reimbursements. The organization realized achieving these goals required improving practice workflows to include using their EHR more effectively. This BP project was CHC, Inc.’s first major quality improvement effort after its EHR implementation, and it ran at the same time as the practice attained Stage 1 meaningful use.
QI Team
The practice formed a QI team consisting of a Quality RN, Medical Director, Operations Director, health education team, and clinic managers.
QI Tools
CHC, Inc. agreed to apply a systematic approach to assess technology, people’s roles, and workflow processes. The team also agreed to apply Plan, Do, Study, Act (PDSA) cycles to document and control their quality work.
QI Approach to Target
CHC, Inc. used the EHR and related tools to:
- Help ensure patients understood their condition and were actively managing it
- Ease how providers manage BP control in patients with diabetes through support for:
- Ordering appropriate tests and interventions
- Gathering, analyzing and documenting key data
- Providing patient education
- Implement a population management approach to monitor, address and report BP control across all its patients with diabetes
- The QI team began by assessing EHR capabilities and their use in relation to the target. They realized that they were not entering BP readings appropriately or accurately in the EHR system, thus making quality reports inaccurate. They used registry data from their EHR-integrated Business Intelligence tool to calculate clinical quality measures (CQMs) such as BP control for DM (e.g., measure numerator = patients at BP goal, measure denominator = all diabetic patients). By comparing this registry data with data pulled directly from the EHR, the team discovered that the registry data and resulting CQMs were not accurate and therefore not useful. They then began to use the direct EHR data to compare and improve the registry functions.
- The team also realized that outpatient problem lists were not properly updated with HTN and DM codes to facilitate automated processing. To make the problem lists more accurately reflect actual patient problems, they used billing codes, medication lists, and feedback from providers to help correct the errors.
- A vital step was ensuring that both essential data points on which the entire BP QI effort rests (e.g., BP measurement and correct entry into the EHR) were reliable and accurate. To accomplish this, they began using automatic blood pressure cuffs and trained staff and clinicians on best practices for taking accurate BP readings. The team then standardized practices for properly entering BP readings into the EHR. The result of these efforts was that CHC, Inc.’s EHR was able to capture accurate BPs in all encounters, which in turn provided accurate registry data useful for population management.
- With high quality BP data from standard and reliable assessment technique and documentation, BP measurement results could be trusted to titrate therapy. Registry data feedback allowed the team to see that these new processes worked month to month and, as a result, more patients were at target.
- The team used the registry to create lists of patients with diabetes and poorly controlled BP. These allowed them to streamline care processes for patients, staff, and providers to optimize BP control (see section ‘Details about Specific CDS Interventions’).
- The team coordinated educational sessions for providers on evidence-based diagnosis and therapy for DM and HTN using Utah State Diabetes Practice Recommendations as a guide.
- On a monthly basis, the QI team reviewed data about performance against the target measures and meaningful use process measures. They developed and/or refined CDS interventions as needed and reinforced successful implementations and workflows to drive further progress. For example, the team used the medical assistant and EHR alerts to identify patients that needed certain tests. They also used texting, phone calls, and letters to contact overdue patients.
- The team meets weekly on EHR related tasks to identify better ways to achieve quality improvements and meaningful use, refine templates for common conditions, and troubleshoot EHR activities.
Details About Specific CDS Interventions
CHC, Inc. applied a broad range of CDS intervention types to accomplish its goal:
- Registries
- Patient lists (registry outputs)
- Documentation templates
- Flow sheets
- Visit summaries
- Order sets
- Relevant data display (highlight in red font abnormal BP readings in EHR)
- Reminders/alerts
Registry
- They made sure that when they documented in the EHR, the structured data flowed correctly to registry areas as well as fulfilled alerts, which improved data collection. Initially, they linked patient problems and diagnosis codes and then refined the location of data entry within the EHR to complete registry data collections.
- The registry reports could be run by clinic, provider, and clinical quality measure, and were used to track patients who were and were not meeting the quality measure. The practice then used the registry to generate recall letters for patients who needed to come in for an office visit.
Patient Lists
The team reviewed patient lists and validated their accuracy in the registry. As part of this effort, the team also:
- Developed routines for identifying pertinent patient cohort and uploading them into registry.
- Worked with EHR/registry vendor to configure EHR to automatically (and accurately) update registry with pertinent new information (e.g., patient office visits).
- Tested the sharing of patient lists (e.g., diabetes patients with uncontrolled blood pressure) with providers, QI team and office staff to update data and recall the patients that are not at goal or who need appointments.
- Assigned staff responsibility and developed workflows for maintaining and using the registry, e.g., reports, data pulls, and alerting providers and patients about care gaps.
- Modified job descriptions accordingly to ensure sustainability of these population management activities.
Provider Quality Scorecard Reports
The team developed provider-specific reports on their measure results and let providers correct errors. These reports were generated by an EHR tool that calculates CQMs. As outlined above, they were using their Business Intelligence tool to troubleshoot and validate the CQM data with a goal of generating accurate information for the scorecards pulled directly from the EHR.
Documentation templates
The team used documentation templates to help standardize care processes across teams. Diabetes templates were standardized across all 4 sites .As part of this effort, the team:
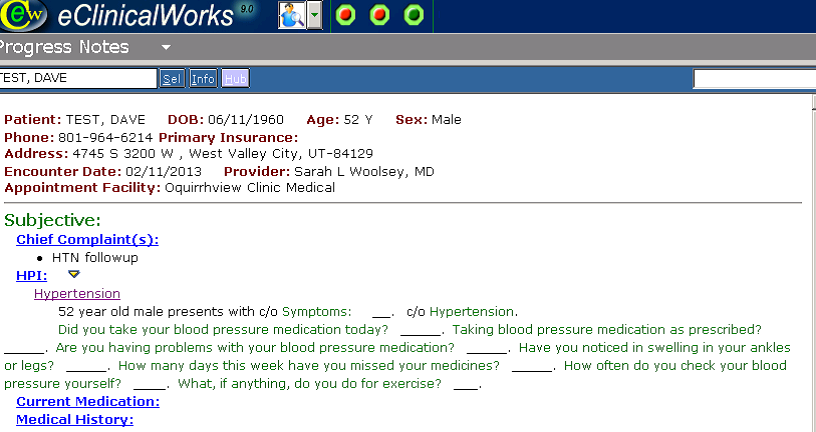
- Created templates to document HTN visits in a manner that ensured key data elements were captured (e.g., patient-reported medication adherence, drug side effects and issues; self-monitoring of blood pressure; and exercise). (See Figure 1 below)
- Validated that templates capture data accurately and fixed problems that arose using EHR vendor support as well as report validation. For example, when entering an eye exam, a provider would check if the data was collected properly, and if not, rework the template.
- Provided clinician/staff training on using the templates effectively, often done along with meaningful use training.
Figure 1: Screenshot showing part of template for documenting hypertension follow-up visit (used with permission from CHC, Inc. and eClinicalWorks)
Alerts and reminders
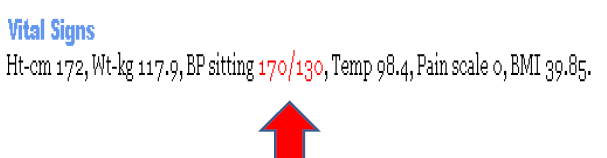
- The team decided to emphasize passive notification (e.g., highlighting abnormal blood pressures where they appear in the EHR as seen in Figure 2) rather than workflow interrupting ‘pop-up’ alerts. As a result, the team used only a few alerts that were deemed necessary to ensure that critical issues were addressed if other efforts to ‘make the right thing easy’ weren’t successful. To start, the team used diabetes alerts for six measures only and later turned on a few preventive care alerts.
- The team trained medical assistants on how to review alerts. Additionally, the RN care manager reviewed alerts prior to patient visits and determined needed testing/evaluations.
Figure 2: Screenshot showing abnormal blood pressure highlighted in red within EHR vital sign screen (used with permission from CHC, Inc. and eClinicalWorks)
Order Sets
The team developed HTN order sets to ease provider ordering. These order sets included: common practice-preferred medications (generics, 90-day supplies); pertinent labs (creatinine, urine protein); home blood pressure monitor prescriptions; education materials for patients on sodium reduction; and referrals for dietary education.
Patient Education/Engagement/Activation
The team uploaded patient education/engagement tools into the EHR to help patients understand and manage their condition. This information is printed from the EHR and reviewed with the patient during the visit by the provider or medical assistant. It includes material on reducing dietary sodium, grids for patients to report BPs at home, pre-populated referrals for dietary education, BP monitor checklists and other tools that support achieving the target.
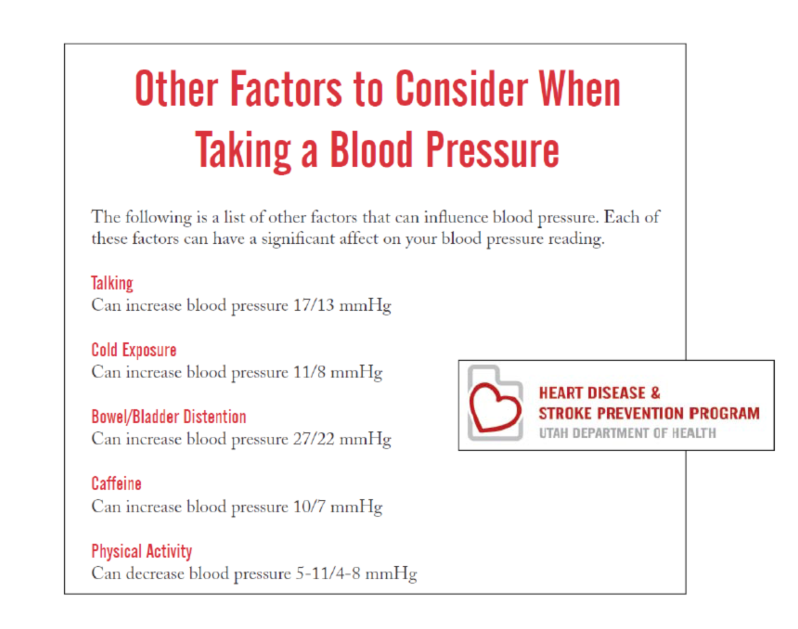
Figure 3: Screenshot showing EHR-generated patient handout about factors affecting BP readings (used with permission from CHC, Inc.)
Medication Adherence Support
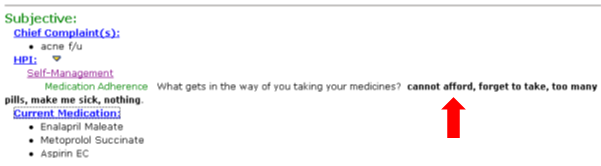
The team built and embedded a Medication Adherence Assessment into the documentation templates as illustrated in Figure 4. Other steps to support medication adherence include:
- Added formularies to e-prescribing lists to minimize patient out-of-pocket costs for medicines.
- Enabled medication fill review within the EHR and recalled patients who were late in filling medications.
- Added default to EHR so that it e-prescribes refills for 90 days for HTN medications to improve adherence by decreasing time patients spend to obtain refills.
Figure 4: Screenshot showing medication adherence issues built into visit documentation template (used with permission from CHC, Inc. and eClinicalWorks)
Visit summaries
The team created visit summaries for the provider to discuss with patients before their visits in the waiting room. It is at that time that the patient would review and confirm the list of medications that the practice had on record for them. The practice used these encounters as opportunities to reeducate patients about their medications appointments and lifestyle goals, while also giving patients the opportunity to explain their self-management activities.
Patient Self-management
- The team would assess patients for depression, which can interfere with patient self-management, by using an EHR-delivered depression screening instrument for type 2 diabetes patients who are not at their BP goal. When depression is identified, the team treated these patients appropriately.
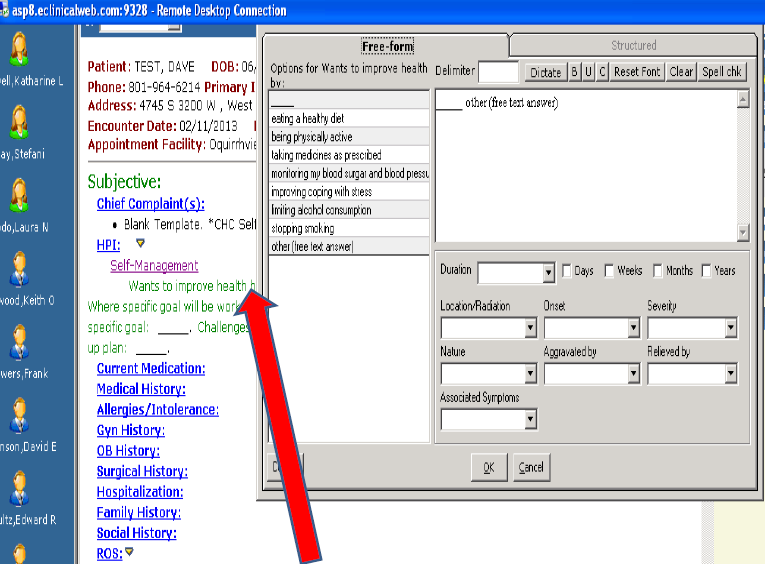
- The team also implemented EHR-supported recall processes using telephone calls, emails and text messages to reach patients as needed to discuss their self-care goals (see Figure 5).
Figure 5: Visit documentation template screenshot highlighting self-management goals
QI Initiative Results:
The percentage of patients with diabetes meeting the measure (BP < 140/90) increased from 63% in January 2011 to 73% in 2013, improving from well below to well above the community baseline.
Next Steps
- Working closely with their EHR vendor, CHC, Inc. will continue to monitor quality measure accuracy from the EHR CQM functions so that the practice can use these reports directly for QI efforts. The practice will continue building on its progress using BP and the seven other diabetes quality care metrics within the Beacon project (e.g., HbA1c screening and control, LDL screening and control, proper attention to nephropathy, screening foot exams, screening retinal exams).
- The practice will continue rolling out the patient portal and developing a more robust tool for sending patients text messages to their smartphones. Providers at the practice had already started to use the portal with greater frequency and are learning how to text patients in lieu of phone calls.
- The practice will begin offering visit summaries in different languages beyond English.
- The team will continue to look at provider efficiency during the patient visit though applying PDSA cycles and regular QI/EHR meetings. CHC, Inc. will also expand patient access to devices for self-monitoring of BP.
Key Lessons
- Make sure that key data (e.g., BP readings documented in both EHR and registry) is reliable. That is, the measurement itself and how it is recorded must be consistently accurate. It is important to trust the data you are using to make individual patient decisions and to track, report and improve population-based quality measures. Seek system vendor support on this.
- Make it easy for clinicians to ‘do the right thing.’ Think about how individual CDS interventions will be used and develop them to optimize value, engage users in this work, and follow-up to unsure that the interventions are delivering the desired support and benefits.
- Use alerts judiciously. Too many and/or inappropriate alerts can cause user frustration and ‘overload’ and lead to very important alerts being ignored.
- Organize ongoing weekly QI/EHR meetings and apply PDSA cycles to make successful, incremental improvements. Use processes that will help you make meaningful use meaningful for the practice; that is, improve care processes and quality.