
Official websites use .gov
A
.gov
website belongs to an official government organization in the
United States.
Secure .gov websites use HTTPS
A
lock
(
) or
https://
means you’ve safely connected to the .gov website. Share sensitive
information only on official, secure websites.
Progress and Ongoing Challenges to Electronic Public Health Reporting Among Non-Federal Acute Care Hospitals
No. 66 | June 2023
As of January 2022, eligible hospitals and critical access hospitals (CAHs) that participate in the Centers for Medicare & Medicaid Services’ (CMS) Medicare Promoting Interoperability (PI) Program are required to electronically submit data to public health agencies (PHAs) for syndromic surveillance, immunization registry, electronic reportable laboratory result (lab reporting), and electronic case reporting. Public health registry and clinical data registry reporting are not required but qualify for bonus points (1). During the COVID-19 pandemic, U.S. hospitals were also required to report data associated with hospital capacity and utilization of medical supplies to assist the government with resource allocation. This data brief uses nationally representative survey data from the 2022 American Hospital Association (AHA) Information Technology (IT) supplement to describe non-federal acute care hospitals’ active engagement towards electronically submitting data for required and optional public health and hospital capacity reporting. This analysis shows progress in hospitals’ rates of electronic reporting since 2021 (2) and highlights challenges that may hinder hospital capacity to contribute timely and accurate data to support PHAs’ ability to effectively respond to current and future public health emergencies.
Highlights
- In 2022, most non-federal acute care hospitals reported actively submitting production data for at least one type of public health reporting using fully or primarily automated processes.
- Submitting data directly through electronic health record (EHR) systems was the most common method used for electronic public health reporting. Health information exchange (HIE) organizations were also used by 14% to 19% of hospitals across the different public health reporting types.
- Despite progress in hospitals’ engagement in electronic public health reporting, reporting rates among lower-resourced (i.e., small, rural, independent, critical access) hospitals continue to lag compared to those of higher-resourced hospitals.
- About three-quarters of hospitals nationally reported experiencing at least one challenge to public health reporting in 2022, ranging from about a quarter to 100 percent of hospitals at the state-level. Types of challenges experienced did not vary notably by reporting type.
In 2022, nearly all hospitals reported they were actively submitting production data for at least one type of public health reporting.
Findings
- Between 2021 and 2022, rates of hospitals’ electronic reporting increased significantly for syndromic surveillance (86%) and electronic lab result reporting (85%), and remained high for immunization registry reporting (90%). In 2021 and 2022, almost half of hospitals reported actively submitting production data for electronic case reporting (47%).
- More than half of hospitals indicated they were electronically reporting to clinical data registries (51%) or public health registries (63%) in 2022 – a significant increase from 2021.
- The share of hospitals who were engaged in at least one type of public health reporting increased significantly between 2021 and 2022.
Figure 1: Percent of non-federal acute care hospitals that reported actively electronically submitting production data for public health reporting, 2021-2022.
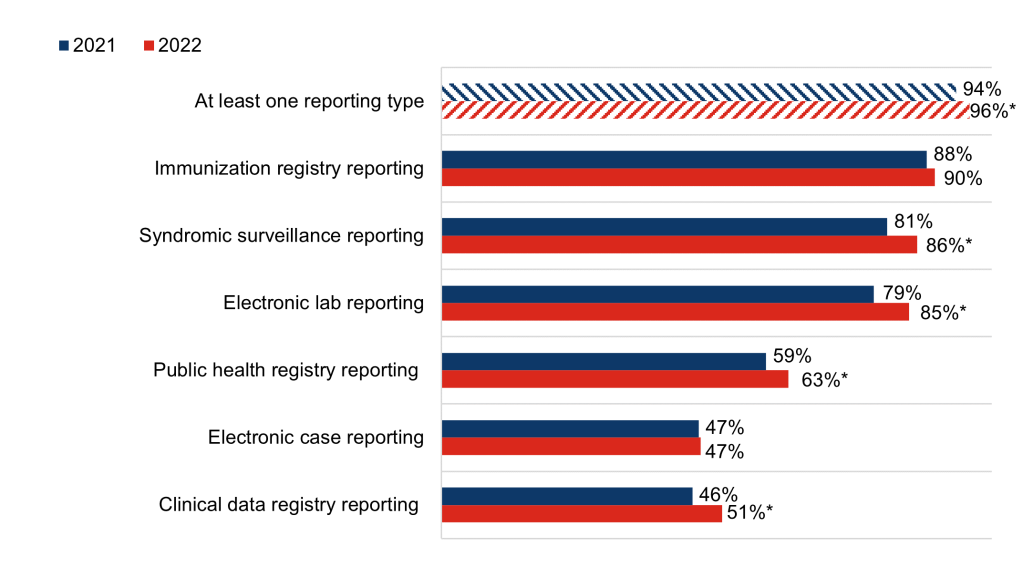
Notes: Observations with missing data were excluded from the denominator. The share of hospitals electronically submitting data for “At least one reporting type” (94%) in 2021 differs from the statistic reported in our 2022 data brief because observations in this brief were excluded from the denominator if responses to all public health reporting questions were blank. In the 2022 data brief, these observations were included but treated as not electronically reporting. * Indicates statistical significance at the 5% level (p < 0.05).
Hospitals’ engagement in electronic public health reporting varied by hospital characteristics
Findings
- In 2022, hospitals were actively submitting production data for about 4 out of 6 reporting types, on average – a statistically significant increase from 2021 (see Appendix Table A1).
- Small, rural, critical access, and independent hospitals were engaged in fewer types of electronic public health reporting, on average, compared to higher resourced hospitals.
- Having an EHR certified by the Office of the National Coordinator for Health IT (ONC) was associated with increased public health reporting. Hospitals without a certified EHR were submitting data electronically for less than 3 reporting types, on average.
Table 1: Mean number of public health reporting types, by hospital characteristics, 2022.
| Hospital Characteristics | Mean Number of Reporting Types (Out of 6) |
|---|---|
| National Average | 4.2 |
| Size | |
| Small < 100 beds (N=1,228) | 3.84* |
| Medium 100-399 beds (N=990) | 4.44* |
| Large > 400 beds (N=323) | 4.81 |
| Ownership | |
| Government (N=486) | 3.50* |
| For-profit (N=325) | 3.91* |
| Non-profit (N=1,729) | 4.45 |
| Location | |
| Rural (N = 988) | 3.73* |
| Suburban-Urban (N = 1,553) | 4.47 |
| Critical Access | |
| Yes (N = 721) | 3.69* |
| No (N = 1,820) | 4.38 |
| System Affiliation | |
| Independent (N = 662) | 3.59* |
| System member (N = 1,879) | 4.45 |
| Certification | |
| Not certified (N=119) | 2.89* |
| Certified EHR (N=2,422) | 4.21 |
Notes: The number of reporting types range from 0 (if not actively engaged in any type of electronic public health reporting) to 6 (if actively engaged in all 6 types). Hospitals were excluded from the denominator if responses to all public health reporting questions were blank (N=76). * Indicates statistical significance at the 5% level (p < 0.05).
EHRs were the most common method used to submit data for all 6 types of public health reporting.
Findings
- Most hospitals engaged in electronic public health reporting used their EHR to directly submit data for public health reporting (ranging from 62% of hospitals for clinical data registry reporting to 84% of hospitals for immunization registry reporting).
- Use of a health information exchange (HIE) organization was the second most common method used to submit data electronically for public health reporting, ranging from 14% of hospitals for clinical data registry reporting to 19% of hospitals for immunization registry and syndromic surveillance reporting.
- In 2022, rates of portal and flat file use were relatively high for public health registry, clinical data registry, and hospital capacity reporting
Figure 2: Methods used to submit data for public health and hospital capacity reporting, 2022.
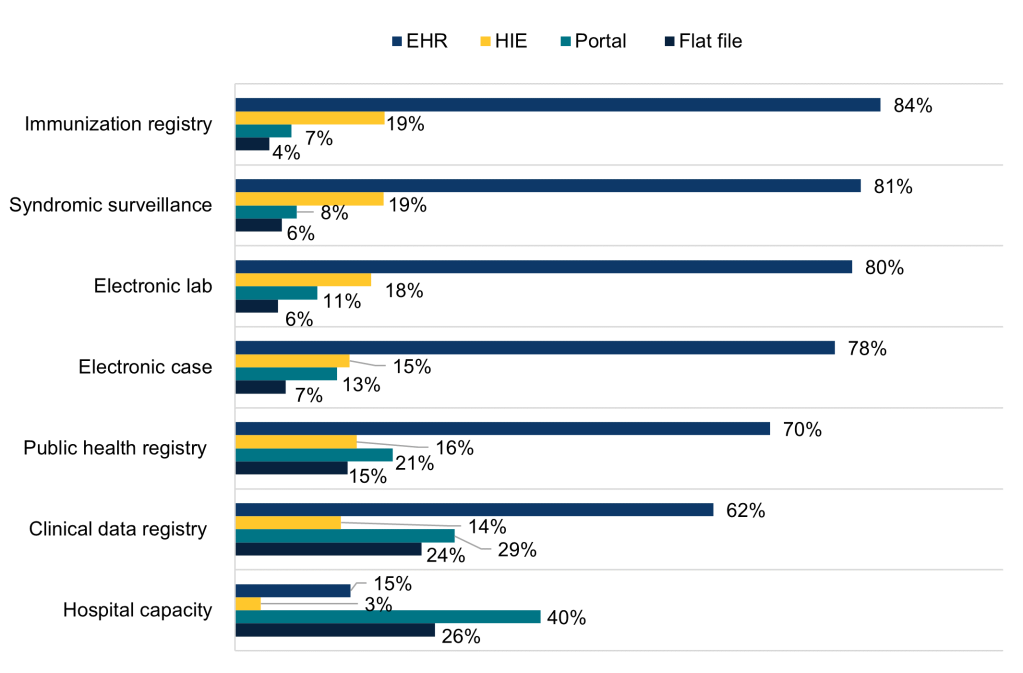
Notes: Public health reporting estimates only include respondents that were “actively electronically submitting production data” for the respective reporting type. Hospital capacity reporting estimates include all respondents. For all reporting types, missing values and “don’t know” and “not electronically submitting” responses were excluded from the denominator. Respondents were instructed to select all options used for each reporting type. Response categories are not mutually exclusive and therefore do not sum to 100 percent.
In 2022, fully or primarily automated processes were predominantly used to submit data electronically for public health reporting.
Findings
- While most hospitals used fully or primarily automated processes for electronic public health reporting, a mix of automated and manual processes were more common for electronic case reporting (26%), public health registry (30%), and clinical data registry (43%) reporting.
- The share of hospitals using fully or primarily automated processes to transmit data was highest for those submitting data directly through EHRs followed by HIEs, flat files, and portals (see Appendix Table A2).
- Unlike other types of electronic public health reporting, hospital capacity reporting primarily occurred through fully manual or a mix of automated and manual processes.
Figure 3: Processes used to submit data for public health and hospital capacity reporting, 2022.
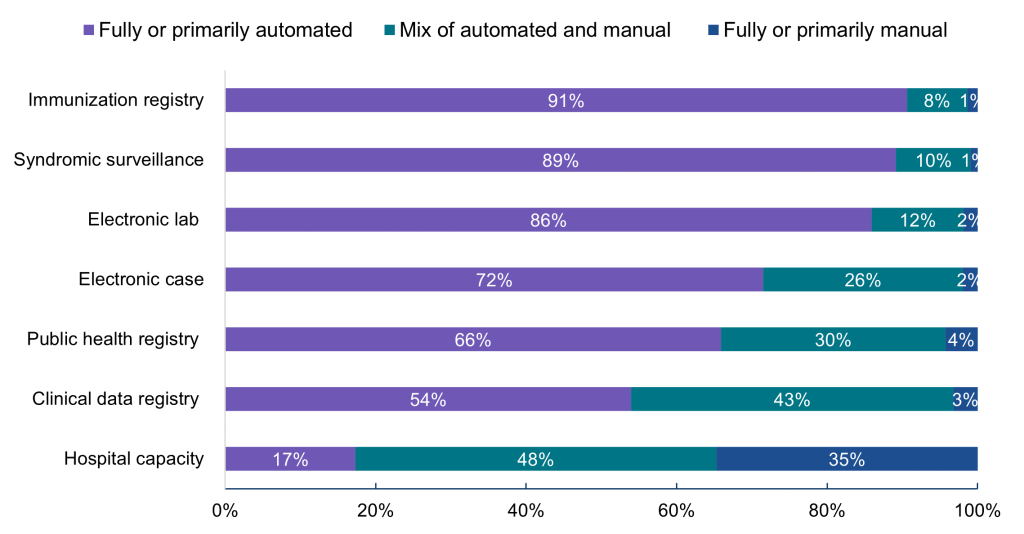
Notes: Hospitals were asked whether they used automated (e.g., EHR generated data sent electronically/automatically to the public health agency), manual (e.g., chart abstraction with data faxed or re-input into a portal), or a mix of both types of processes (e.g., files electronically generated from the EHR, but manual steps required to transmit to public health agency) to transmit data for public health reporting. Public health reporting estimates only include respondents that were “actively electronically submitting production data” for the respective reporting type. Hospital capacity reporting estimates include all respondents. For all reporting types, missing values and “don’t know/NA” responses were excluded from the denominator.
About three-quarters of hospitals reported experiencing at least one challenge to public health reporting in 2022.
Findings
- Public health reporting challenges were highest for public health registry reporting (53%) and electronic case reporting (57%).
- On average, hospitals reported the most challenges for clinical data registry (3.6) and public health registry (3.5) reporting. Hospitals reported the fewest challenges, on average, for electronic lab (2.9) and immunization registry (2.8) reporting.
- While only 47% of hospitals experienced at least one challenge for syndromic surveillance reporting, these hospitals experienced 3.3 challenges on average (out of 8) which is comparable to the breadth of challenges experienced for electronic case reporting.
Table 2: Percent of hospitals that reported experiencing at least one challenge for each reporting type and mean number of challenges experienced (among those reporting at least one challenge).
| Number of public health reporting challenges | At least one challenge | Mean (Out of 8 challenges) |
|---|---|---|
| All reporting types | 76% | 3.2 |
| Electronic case reporting | 57% | 3.3 |
| Public health registry reporting | 53% | 3.5 |
| Clinical data registry reporting | 49% | 3.6 |
| Immunization registry reporting | 48% | 2.8 |
| Electronic lab reporting | 47% | 2.9 |
| Syndromic surveillance reporting | 47% | 3.3 |
Notes: Excludes 74 respondents who didn’t respond to any questions in the public health reporting section. At least one = percent of hospitals that experienced at least one challenge. Mean (out of 8) = Mean number of challenges (out of 8 possible challenges) experienced by hospitals that reported at least one challenge
Not all public health reporting challenges were common in 2022, but reported challenges tended to occur across reporting types.
Findings
- Half of hospitals felt PHAs lacked the capacity to electronically receive information for at least one reporting type (3.7 types on average among those reporting this challenge). See Appendix Table A3 for the share of hospitals experiencing challenges for each reporting type.
- Onboarding and cost-related challenges were reported for more reporting types on average (4.4 to 4.5 types out of 6) than challenges related to hospitals’ lack of capacity to send information, difficulties extracting relevant information from the EHR, and use of different vocabulary standards (3.3 to 3.4 types out of 6).
Table 3: Percent of hospitals that reported experiencing a given challenge for at least one public health reporting type in 2022 and mean number of reporting types (among those experiencing the challenge for at least one reporting type).
| At least one reporting type | Mean No. (Out of 6 types) | |
|---|---|---|
| Hospitals feel PHAs lack the capacity to electronically receive information | 50% | 3.7 |
| Hospitals report they lack the capacity to electronically send information | 16% | 3.3 |
| Technical complexity of interfaces, transmission, or submission process | 39% | 3.5 |
| Cost related to interfaces, transmission, or submission | 26% | 4.4 |
| Use different vocabulary standards than PHAs, making it difficult to submit | 16% | 3.4 |
| Difficulty extracting relevant information from EHR | 19% | 3.4 |
| Data not stored in a discrete format within the EHR | 13% | 3.7 |
| Onboarding process for electronic reporting is too cumbersome | 38% | 4.5 |
Notes: Excludes 74 respondents who didn’t respond to any questions in the public health reporting section. At least one = percent of hospitals that experienced a given challenge for at least one reporting type. Mean (out of 6) = Mean number of reporting types (out of 6) reported by hospitals that experienced the challenge for at least one reporting type.
The share of hospitals that reported experiencing public health challenges varied by state.
Findings
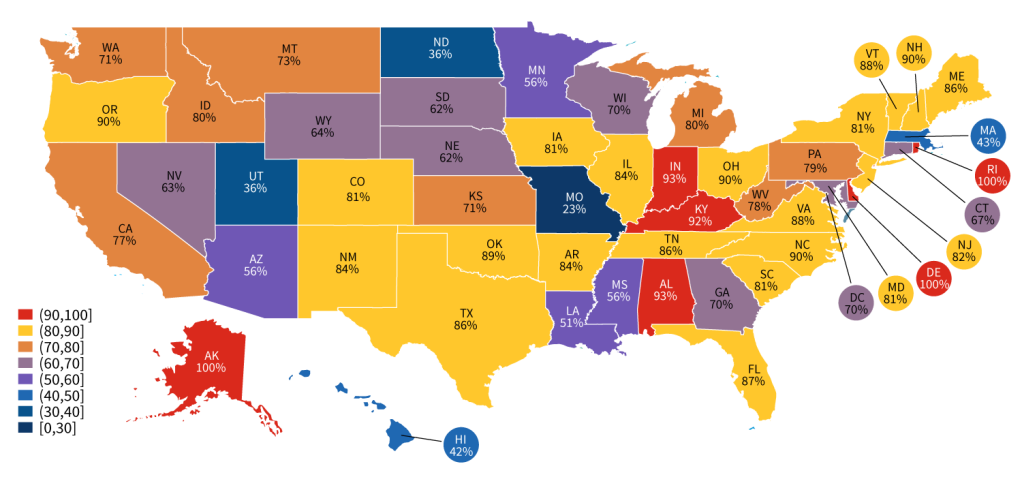
- The share of hospitals that reported experiencing at least one public health reporting challenge ranged from 23% to 100% of hospitals in a given state.
- In 2022, there were only 5 states—MO, UT, ND, HI, and MA—where less than half of the hospitals reported experiencing at least one challenge to public health reporting (see Appendix Table A4).
Figure 4: Percent of hospitals that reported experiencing at least one public health reporting challenge in 2022, by state.
Summary
In 2022, most non-federal acute care hospitals (96%) reported actively submitting production data for at least one type of public health reporting—a significant increase from 2021. Reporting rates were highest for immunization registry, syndromic surveillance, and electronic reportable laboratory results reporting, which have been core performance objectives since the early stages of the PI Program (formerly Meaningful Use) and were required in 2022 (3). Public health and clinical data registry reporting, which are not required but qualify for bonus points, also increased significantly between 2021 and 2022.
Reporting rates were lowest for electronic case reporting, which was added as an optional measure relatively late in the PI program and became a required measure for the first time in 2022. Since hospitals could satisfy their public health reporting requirements through other means, the demand for EHR products with electronic case reporting functionality has historically been low (4). While overall rates of electronic case reporting did not change between 2021 and 2022, fewer hospitals were submitting data electronically using fully manual processes in 2022 (2% compared to 6% in 2021). This increase in automation is likely attributable to a targeted effort led by the Centers for Disease Control and Prevention (CDC) and Association of Public Health Laboratories to advance the adoption of electronic case reporting(5). To further facilitate faster and more efficient case management, ONC’s new proposed rule would require that Health IT Modules support eCR using consensus-based, industry developed standards. The move from functional to standards-based requirements would facilitate bi-directional exchange between providers and PHAs and help ensure PHAs have access to timely and accurate case reporting information.
Directly submitting data through EHRs was the most common method used for required electronic public health reporting (ranging from 78% of hospitals for electronic case reporting to 84% of hospitals for immunization registry reporting), followed by submitting data through HIEs (ranging from 15% of hospitals for electronic case reporting to 19% of hospitals for immunization registry reporting). While portal and flat file use was less common for required reporting types, these methods were used by 15% to 29% of hospitals for public health and clinical data registry reporting. These were also the main methods used to submit data for hospital capacity reporting, which was a CMS condition of participation for hospitals and CAHs implemented in 2020, during the COVID-19 pandemic, to assist the government with resource allocation (6).
In 2022, most hospitals reported submitting public health data electronically using fully or primarily automated processes (ranging from 54% of hospitals for clinical data registry reporting to 91% of hospitals for immunization registry reporting). However, manual processes or a mix of automated and manual processes were predominantly used for hospital capacity reporting, which is likely due to greater reliance on portals and flat files for this type of reporting. Unlike other types of public health reporting, there is no certification criterion for hospital capacity reporting and thus there may be limited capacity built into EHRs to support automated reporting. Across reporting types, the share of hospitals using fully or primarily automated processes to transmit data was higher for those submitting data directly through EHRs or through HIEs for reporting compared to those using portals and flat files (Appendix Table A2).
Despite progress in hospitals’ rates of electronic public health reporting, in 2022, about three-quarters of hospitals nationally reported experiencing at least one challenge to public health reporting, ranging from 23 to 100 percent of hospitals within a given state. The most common challenges cited by hospitals were PHAs’ lack of capacity to electronically receive information and the technical complexity of interfaces, transmission, or submission processes for electronic reporting, which were reported by 50 and 39 percent of hospitals, respectively, for at least one reporting type. Cost-related challenges and reports of onboarding processes for electronic reporting being too cumbersome were also reported by more than a quarter of hospitals for at least one type of reporting. While not all public health reporting challenges were common, reported challenges tended to occur consistently across reporting types.
Taken together, these findings suggest that the CDC’s ongoing Data Modernization Initiative (DMI) efforts, particularly those targeting specific reporting types, are critical to addressing barriers to electronic public health reporting and improving health information exchange between healthcare providers and PHAs. Efforts to promote data standardization through the Health IT Certification Program, can help mitigate reporting challenges related to the use of different vocabulary standards and difficulties extracting relevant information from EHRs. Standardization can also help support automated reporting of health information for public health purposes. ONC is working to advance standards to facilitate public health data exchange through ONC’s new proposed rule to standardize electronic case reporting, and through USCDI+, an initiative aimed at identifying and establishing public health specific datasets that will operate as extensions to the existing United States Core Data for Interoperability (USCDI) standard (7). Building on this groundwork, ONC’s Trusted Exchange Framework and Common Agreement (TEFCA) initiative will help further advance interoperability for healthcare providers, hospitals, and PHAs by providing the infrastructure for more seamless nationwide health information exchange (8).
Definitions
Critical Access Hospital: Hospitals with less than 25 beds and at least 35 miles away from another general or critical access hospital.
Large hospital: Non-federal acute care hospitals of bed sizes of 400 or more.
Medium hospital: Non-federal acute care hospitals of bed sizes of 100-399.
Non-federal acute care hospital: Hospitals that meet the following criteria: acute care general medical and surgical, children’s general, and cancer hospitals owned by private/not-for-profit, investor-owned/for-profit, or state/local government and located within the 50 states and District of Columbia.
Public Health Agency (PHA): state and local public health agencies support interoperability efforts and data exchange with electronic health records, many of which have been utilized by the Centers for Medicare & Medicaid Services (CMS) Promoting Interoperability Programs.
Rural hospital: Hospitals located in a non-metropolitan statistical area.
Small hospital: Non-federal acute care hospitals of bed sizes of 100 or less.
System Affiliated Hospital: A system is defined as either a multi-hospital or a diversified single hospital system. A multi-hospital system is two or more hospitals owned, leased, sponsored, or contract managed by a central organization. Single, freestanding hospitals may be categorized as a system by bringing into membership three or more, and at least 25 percent, of their owned or leased non-hospital pre-acute or post- acute health care organizations.
Data Sources and Methods
Data are from the American Hospital Association (AHA) Information Technology (IT) Supplement to the AHA Annual Survey. Since 2008, ONC has partnered with the AHA to measure adoption and use of health IT in U.S. hospitals. ONC funded the 2022 AHA IT Supplement to track hospital reported adoption and use of EHRs and the exchange of clinical data.
The chief executive officer of each U.S. hospital was invited to participate in the survey regardless of AHA membership status. The person most knowledgeable about the hospital’s health IT (typically the chief information officer) was requested to provide the information via a mail survey or secure online site. Non- respondents received follow-up mailings and phone calls to encourage response.
This brief reports results from the 2020 and 2022 AHA IT Supplements. Due to pandemic-related delays, the 2020 survey was not fielded until April 2021 to September 2021. Since the IT supplement surveys instruct respondents to answer questions as of the day the survey is completed, we refer to responses to the 2020 IT supplement survey as occurring in 2021. The response rate for non-federal acute care hospitals (N = 2,359) in the 2020 survey was 54 percent. The 2022 survey was fielded from July 2022 to December 2022 and the response rate for non-federal acute care hospitals (N = 2,541) was 59 percent.
A logistic regression model was used to predict the propensity of survey response as a function of hospital characteristics, including size, ownership, teaching status, system membership, and availability of a cardiac intensive care unit, urban status, and region. Hospital-level weights were derived by the inverse of the predicted propensity.
References
- Centers for Medicare & Medicaid Services. 2022 Medicare Promoting Interoperability Program for Eligible Hospitals and Critical Access Hospitals: Public Health and Clinical Data Exchange Objective Fact Sheet [Internet]. Baltimore (MD): Centers for Medicare and Medicaid Services. Available from: https://www.cms.gov/files/document/2022-public-health-and-clinical-data- exchange-objective-fact-sheet.pdf.
- Richwine C, Everson, J, & Patel, V. Electronic Public Health Reporting among Non-Federal Acute Care Hospitals During the COVID-19 Pandemic, 2021. ONC Data Brief [Internet]. 2022 Sept; 62. Available from: https://www.healthit.gov/data/data-briefs/electronic-public-health-reporting- among-non-federal-acute-care-hospitals-during.
- Centers for Medicare & Medicaid Services. Medicare & Medicaid EHR Incentive Program Meaningful Use Stage 1 Requirements Overview [Internet]. Baltimore (MD): Centers for Medicare and Medicaid Services. Available from: https://www.cms.gov/Regulations-and- Guidance/Legislation/EHRIncentivePrograms/downloads/mu_stage1_reqoverview.pdf.
- Myers, E & Smith, J. Federal Agencies Align to Promote Public Health Reporting [Internet]. 2021 Jun. Available from: https://www.healthit.gov/blog/health-it/federal-agencies-align-to- promote-public-health-reporting.
- Centers for Disease Control and Prevention. eCR Now: COVID-19 Electronic Case Reporting for Healthcare Providers. Improve public health action with real-time data flow [Internet]. Atlanta (GA): Centers for Disease Control and Prevention. Available from: https://www.cdc.gov/coronavirus/2019-ncov/downloads/hcp/eCR-Now-Electronic-Case- Reporting-for-healthcare-providers.pdf.
- Centers for Medicare & Medicaid Services. COVID-19 Guidance for Hospital Reporting and FAQs For Hospitals, Hospital Laboratory, and Acute Care Facility Data [Internet]. Baltimore (MD): Centers for Medicare & Medicaid Services; 2022 Dec. Available from: Reporting https://www.hhs.gov/sites/default/files/covid-19-faqs-hospitals-hospital-laboratory-acute-care-facility-data-reporting.pdf
- Argentieri, R, Myers, E, Posnack, S, & Tripathi, M. Thinking Outside the Box: The USCDI+ Initiative [Internet]. 2021 Oct. Available from: https://www.healthit.gov/blog/health-it/thinking- outside-the-box-the-uscdi-initiative.
- Tripathi, M & Yeager, M. Building TEFCA [Internet]. 2023 Feb. Available from: https://www.healthit.gov/blog/electronic-health-and-medical-records/interoperability- electronic-health-and-medical-records/building-tefca
Acknowledgments
The author is with the Office of Technology, within the Office of the National Coordinator for Health Information Technology. The data brief was drafted under the direction of Mera Choi, Director of the Technical Strategy and Analysis Division, Vaishali Patel, Deputy Director of the Technical Strategy and Analysis Division, and Wesley Barker, Chief of the Data Analysis Branch with subject matter expertise from Rachel Abbey.
Suggested Citation
Richwine, C. Progress and Ongoing Challenges to Electronic Public Health Reporting Among Non-Federal Acute Care Hospitals. ONC Data Brief [Internet]. 2023 June; 66.
Appendix
Appendix Table A1: Mean number public health reporting types, 2021-2022.
| 2021 | 2022 | |
|---|---|---|
| Mean number of reporting types | 3.9 | 4.2* |
| Among those who report at least one | 4.2 | 4.4* |
Appendix Table A2: Percent of non-federal acute care hospitals using fully or primarily automated processes to transmit data, by method of public health and hospital capacity reporting, 2022.
| EHR | HIE | Flat file | Portal | |
|---|---|---|---|---|
| Immunization registry reporting | 94% | 86% | 80% | 52% |
| Syndromic surveillance reporting | 92% | 87% | 55% | 33% |
| Electronic lab result reporting | 89% | 87% | 75% | 56% |
| Electronic case reporting | 79% | 65% | 55% | 26% |
| Public health registry reporting | 77% | 60% | 30% | 30% |
| Clinical data registry reporting | 67% | 68% | 32% | 27% |
| Hospital capacity reporting | 50% | 34% | 12% | 4% |
Appendix Table A3: Percent of hospitals that reported experiencing challenges to public health reporting in 2022, by reporting type.
| Syndromic Surveillance | Immunization Registry | Electronic Case | Public Health Registry | Clinical Data Registry | Electronic Lab | |
|---|---|---|---|---|---|---|
| Hospitals feel PHAs lack the capacity to electronically receive information | 21% | 23% | 31% | 27% | 28% | 21% |
| Hospitals report they lack the capacity to electronically send information | 5% | 3% | 8% | 9% | 10% | 4% |
| Technical complexity of interfaces, transmission, or submission process | 19% | 14% | 21% | 19% | 20% | 15% |
| Cost related to interfaces, transmission, or submission | 15% | 13% | 17% | 18% | 19% | 12% |
| Use different vocabulary standards than PHAs, making it difficult to submit | 5% | 4% | 8% | 7% | 9% | 5% |
| Difficulty extracting relevant information from EHR | 6% | 4% | 8% | 10% | 12% | 4% |
| Data not stored in a discrete format within the EHR | 5% | 3% | 5% | 6% | 8% | 4% |
| Onboarding process for electronic reporting is too cumbersome | 21% | 24% | 26% | 21% | 16% | 21% |
Notes: Excludes 74 respondents who didn’t respond to any questions in the public health reporting section. At least one = percent of hospitals that experienced a given challenge for at least one reporting type.
Appendix Table A4: Percent of hospitals experiencing at least one public health reporting challenge in 2022, by state.
| State | Report at least one challenge | N | # Hospitals in IT Survey | # Hospitals in State | % Hospitals Surveyed |
|---|---|---|---|---|---|
| AK | 100% | 8 | 8 | 26 | 31% |
| AL | 93% | 24 | 31 | 117 | 26% |
| AR | 84% | 37 | 46 | 104 | 44% |
| AZ | 56% | 16 | 33 | 112 | 29% |
| CA | 77% | 96 | 131 | 415 | 32% |
| CO | 81% | 38 | 48 | 106 | 45% |
| CT | 67% | 13 | 20 | 42 | 48% |
| DC | 70% | 3 | 4 | 14 | 29% |
| DE | 100% | 4 | 4 | 13 | 31% |
| FL | 87% | 109 | 126 | 252 | 50% |
| GA | 70% | 45 | 66 | 173 | 38% |
| HI | 42% | 2 | 5 | 28 | 18% |
| IA | 81% | 76 | 98 | 122 | 80% |
| ID | 80% | 12 | 17 | 52 | 33% |
| IL | 84% | 92 | 113 | 208 | 54% |
| IN | 93% | 52 | 58 | 161 | 36% |
| KS | 71% | 41 | 62 | 151 | 41% |
| KY | 92% | 51 | 56 | 121 | 46% |
| LA | 51% | 15 | 34 | 204 | 17% |
| MA | 43% | 10 | 23 | 102 | 23% |
| MD | 81% | 29 | 36 | 63 | 57% |
| ME | 86% | 14 | 17 | 39 | 44% |
| MI | 80% | 54 | 70 | 161 | 43% |
| MN | 56% | 41 | 75 | 140 | 54% |
| MO | 23% | 26 | 104 | 142 | 73% |
| MS | 56% | 23 | 44 | 112 | 39% |
| MT | 73% | 23 | 32 | 65 | 49% |
| NC | 90% | 58 | 65 | 136 | 48% |
| ND | 36% | 6 | 20 | 49 | 41% |