
In May 2020, the Office of the National Coordinator for Health IT (ONC) finalized federal rulemaking that aimed to increase the access, exchange, and use of electronic health information by patients and their caregivers (1). This rule implements key provisions of the 21st Century Cures Act that require certain certified health IT developers to adopt secure, standards-based application programming interfaces (APIs) that enable individuals to access and manage their health records using a smartphone health app of their choice (2). This brief analyzes data from the Health Information National Trends Survey (HINTS), a nationally representative survey of U.S. adults which was fielded from January 2020 through April 2020. These findings largely reflect pre-pandemic rates of individuals being offered and subsequently using their online medical record, also known as a patient portal. The brief also examines individuals’ use of smartphone health apps to manage health information, and the role of provider encouragement in prompting individuals to use these tools.
HIGHLIGHTS
- About six in 10 individuals nationwide were offered access to their patient portal and nearly 40 percent accessed their record at least once in 2020.
- Nearly four in 10 patient portal users accessed their portal through a smartphone health app in 2020.
- Individuals encouraged by their health care provider to use their patient portal accessed and used their portal at higher rates compared to those not encouraged.
- About a third of patient portal users downloaded their online medical record in 2020 – this proportion has nearly doubled since 2017.
About six in 10 individuals nationwide were offered a patient portal in 2020 – this represents a 17 percentage point increase since 2014.
FINDINGS
★ Nearly 40 percent of individuals nationwide accessed a patient portal in 2020 – this represents a 13 percentage point increase since 2014.
★ The proportion of individuals who were offered and accessed a patient portal did not increase between 2019 and 2020.
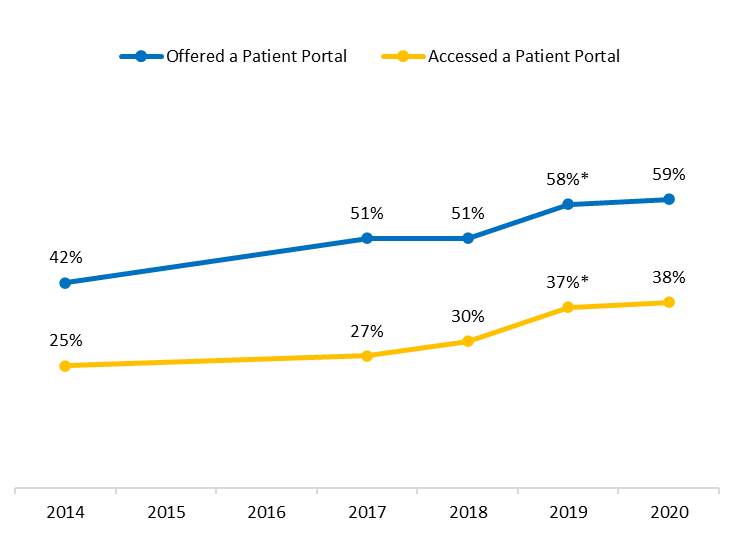
Figure 1: Percent of individuals nationwide who were offered and accessed a patient portal, 2014-2020.
Source: HINTS 4 Cycle 4 (2014); HINTS 5, Cycles 1-4 (2017-2020).
Note: *Significantly different from previous year (p<0.05). Denominator represents all individuals. Percentage reflects weighted national estimate for individuals offered a patient portal by a health care provider or insurer. The HINTS survey was not fielded in 2015 and 2016.
Among individuals offered a patient portal, more than six in 10 accessed it at least once in 2020 – this represents an 11 percentage point increase from 2017.
FINDINGS
★ Among individuals who were offered access to their patient portal, about three in 10 accessed their portal one to two times in 2020.
★ Among individuals offered access to their patient portal, about one in five accessed their portal six or more times in 2020.
★ The frequency of individuals accessing their patient portal increased in 2019, but did not change in 2020.
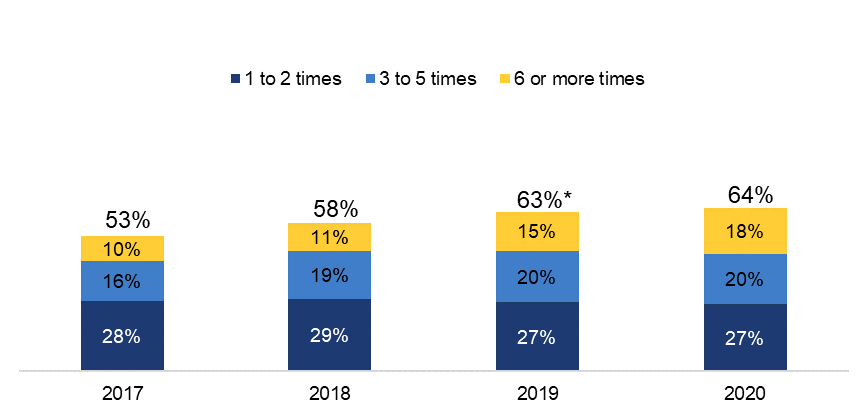
Figure 2: Frequency of individuals accessing their patient portal within the past year, 2017-2020.
Source: HINTS 5, Cycles 1-4 (2017-2020)
Notes: *Significantly different from previous year (p<0.05). Numbers may not add up due to rounding. Denominator represents individuals who were offered access to their patient portal by a health care provider or insurer for each year.
Nearly four in 10 patient portal users accessed their health information using a smartphone health app in 2020.
FINDINGS
★ About one in five patient portal users (22%) accessed their health information using both a smartphone health app and a computer in 2020.
★ Patient portal users most commonly accessed their health information through a computer (83%) – six in 10 portal users accessed their health information using only this method.
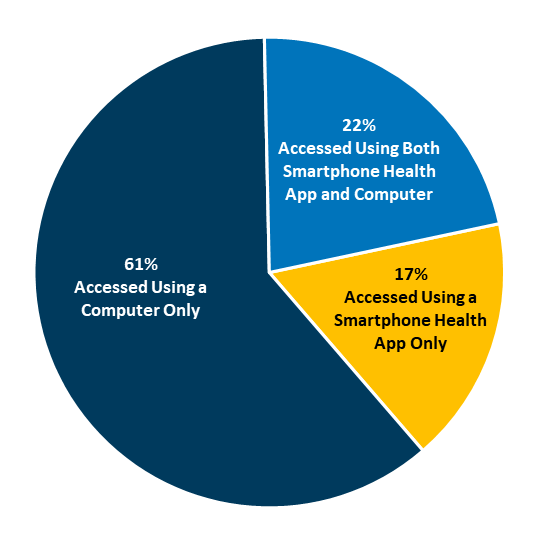
Figure 3: Methods individuals use to access their patient portal, 2020
Source: HINTS 5, Cycle 4 (2020)
Notes: Denominator represents individuals who accessed their patient portal at least once within the past year. Individuals who access their portal at least once in the past year are referred to as “patient portal users”.
Patient portal users who access their health information using multiple methods access their portal more frequently than those who use only one method.
FINDINGS
★ Among patient portal users who accessed their portal 6 or more times in 2020, 45 percent used both a computer and a smartphone health app compared to 22 percent who used only a computer and 28 percent who used only a smartphone health app.
★ Among patient portal users who accessed their portal 1 to 2 times in 2020, 26 percent used both a computer and a smartphone health app compared to about four in 10 who used a computer or smartphone only.
★ Among patient portal users who accessed their portal 3 to 5 times in 2020, there was no significant difference in the methods individuals used to access their portal.
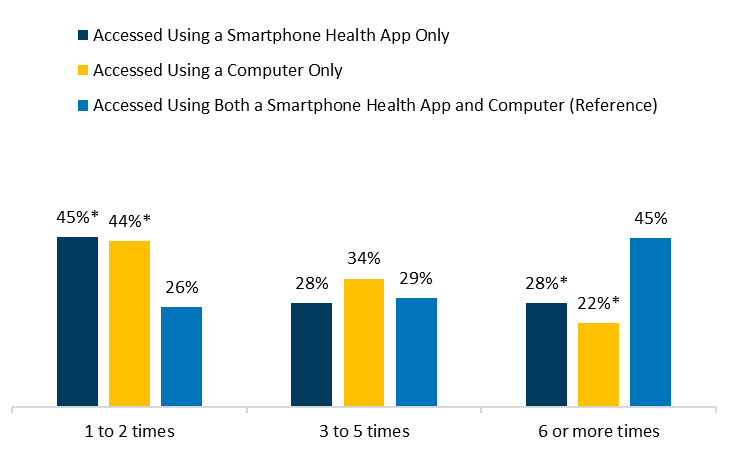
Figure 4: Methods used by patient portal users in the past year by frequency of access, 2020.
Source: HINTS 5, Cycles 1-4 (2017-2020)
Notes: *Significantly different from reference group within each frequency category (p<0.05). Numbers may not add up due to rounding. Denominator represents individuals who accessed their patient portal at least once within the past year (referred to as “patient portal users”).
Individuals’ use of patient portals to communicate and share health information has increased since 2017.
FINDINGS
★ About six in 10 patient portal users exchanged secure messages with their health care provider in 2020 – this represents a 10 percentage point increase from 2017.
★ About a quarter of patient portal users added health information to their portal to share with their health care provider in 2019 – this represents a six percentage point increase from 2017.
★ One in 10 patient portal users requested a correction of inaccurate information posted in their portal in 2019.
★ More than half of patient portal users viewed clinical notes written by their health care provider in 2020.
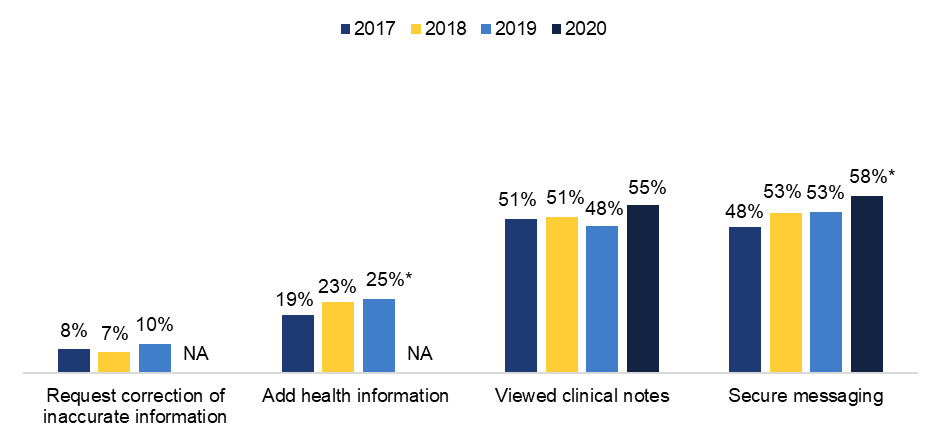
Figure 5: Percent of patient portal users who performed various functionalities in the past year, 2017-2020.
Source: HINTS 5, Cycles 1-4 (2017-2020)
Notes: *Significantly different from 2017 (p<0.05). Denominator represents individuals who accessed their portal at least once within the last year. Data for “Request correction of inaccurate information” and “Add health information” were not collected in 2020. Individuals who access their portal at least once in the past year are referred to as “patient portal users”.
About a third of patient portal users downloaded their online medical record in 2020 – this proportion has nearly doubled since 2017.
FINDINGS
★ Nearly nine in 10 patient portal users viewed test results in their portal in 2020 – this proportion has remained high since 2017.
★ About one in five patient portal users transmitted their health data to an outside party (i.e., another healthcare provider, caregiver, or app/service) in 2020 – this represents a 7 percentage point increase since 2017.
★ Few portal users transmitted their health data to a service or app, however, there has been a significant increase in the transmission of data to another healthcare provider – a 7 percentage point increase from 2017
View, Download or Transmit | 2017 | 2018 | 2019 | 2020 |
|---|---|---|---|---|
View test results | 85% | NA | 86% | 86% |
Download online medical record | 17% | 26%* | 27%* | 32%* |
Transmitted data to at least one outside party | 14% | 17% | 19%* | 21%* |
Transmit to another healthcare provider | 10% | 14% | 15%* | 17%* |
Transmit to caregiver | 4% | 4% | 6% | 5% |
Transmit to service or app | 3% | 3% | 5% | 5% |
Table 1: Percent of patient portal users that viewed, downloaded, or transmitted data from their portal in the past year, 2017-2020.
Source: HINTS 5, Cycles 1-4 (2017-2020)
Notes: *Significantly different from 2017 (p<0.05). Denominator represents individuals who accessed their patient portal at least once within the last year. Data for “View Test Results” was not collected in 2018. Individuals who access their portal at least once in the past year are referred to as “patient portal users”.
The top two reasons for not accessing a patient portal have remained consistent since 2017, with individuals citing their preference to speak to a health care provider directly and perceived lack of need.
FINDINGS
★ About seven in 10 individuals cited their preference to speak with their health care provider directly as a reason for not using their patient portal within the past year.
★ About one-quarter of individuals who did not view their patient portal within the past year reported concerns about privacy and security..
★ About 20 percent of individuals indicated the reason they did not access their patient portal was because they were uncomfortable with computers.
★ About one-quarter cited difficulties logging in as a reason for not accessing their portal.
Reason for Not Using Online Record | 2017 | 2018 | 2019 | 2020 |
|---|---|---|---|---|
Prefer to speak to health care provider directly | 76% | 73% | 75% | 69% |
Do not have a way to access the website | 20% | 10%* | 15%* | 13% |
Did not have a need to use your online medical record | 59% | 65% | 64% | 63% |
Concerned about the privacy/security of online medical record | 25% | 14%* | 20%* | 24% |
No longer have an online medical record | 19% | 13% | 14% | 13% |
Difficult to login | - | - | 22% | 24% |
Uncomfortable with computers | - | - | 22% | 20% |
Have more than one online medical record | - | - | 12% | 8%* |
Table 2: Reasons for not accessing a patient portal among individuals who were offered but did not use their portal within the past year, 2017-2020.
Source: HINTS 5, Cycles 1-4 (2017-2020)
Notes: *Significantly different from previous year (p<0.05). Denominator represents individuals who were offered a patient portal but did not access their portal within the past year.
Individuals encouraged by their health care provider access and use their patient portal at higher rates compared to those not encouraged.
FINDINGS
★ Among individuals who were offered a patient portal, about eight in 10 were encouraged by their health care provider to use it.
★ Seventy-one percent of individuals encouraged by their health care provider accessed their portal at least once in the past year compared to 48 percent who were not encouraged.
★ Individuals encouraged by their health care provider to use their patient portal viewed clinical notes and sent secure messages with their provider at higher rates compared to those not encouraged.
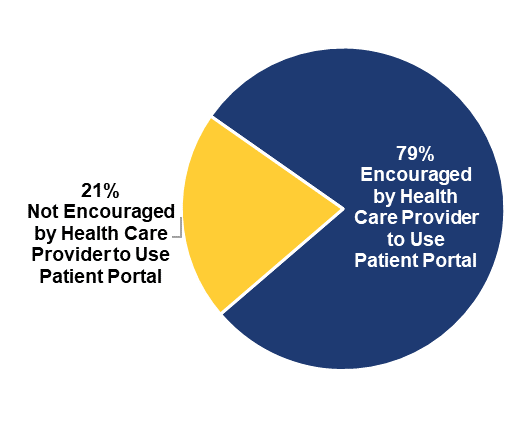
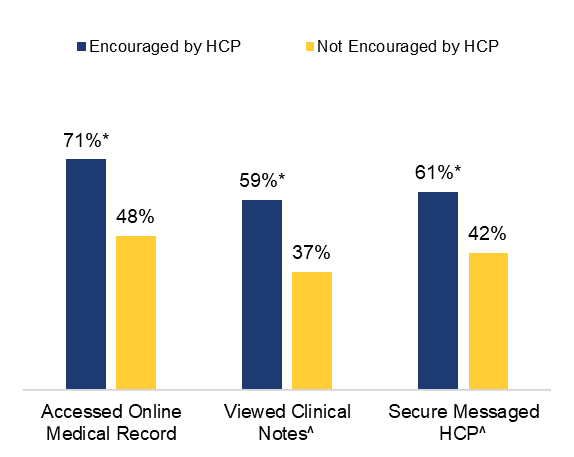
Source: HINTS 5, Cycle 4 (2020)
Notes: Analyses were limited to individuals who were offered access to a patient portal by a health care provider. ^Denominator for specific uses of a patient portal is among those who accessed their portal at least once in the past year. *Significantly different from “Not Encouraged by a Health Care Provider” group (p<0.05).
Eighty-five percent of individuals who have a mobile health app reported using it at least once in the past year.
FINDINGS
★ Nearly nine in 10 individuals nationwide (89%) reported owning a tablet or smartphone in 2020.
★ Half of individuals nationwide reported having a mobile health app in 2020.
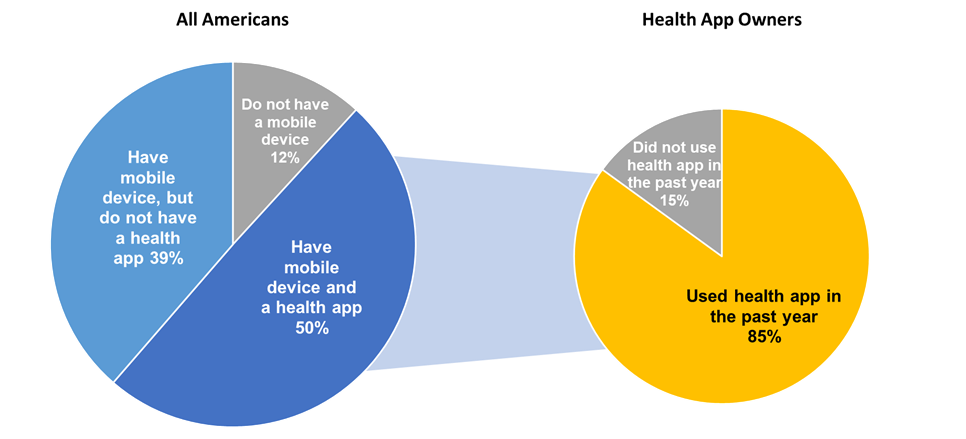
Figure 8: Percent of individuals who reported owning and using a mobile health app in the past year, 2020.
Source: HINTS 5, Cycle 4 (2020)
Notes: Figure on the left represents all individuals. Figure on the right represents those who own a mobile health app.
About seven in 10 individuals with a mobile health app used it to track progress on a health-related goal in 2020.
FINDINGS
★ More than half of individuals used their mobile health app to facilitate discussions with their health care provider in 2020 – this represents an 8 percentage point increase from 2017.
★ The proportion of individuals that use their health app to make decisions about how to treat an illness or condition has remained unchanged since 2017.
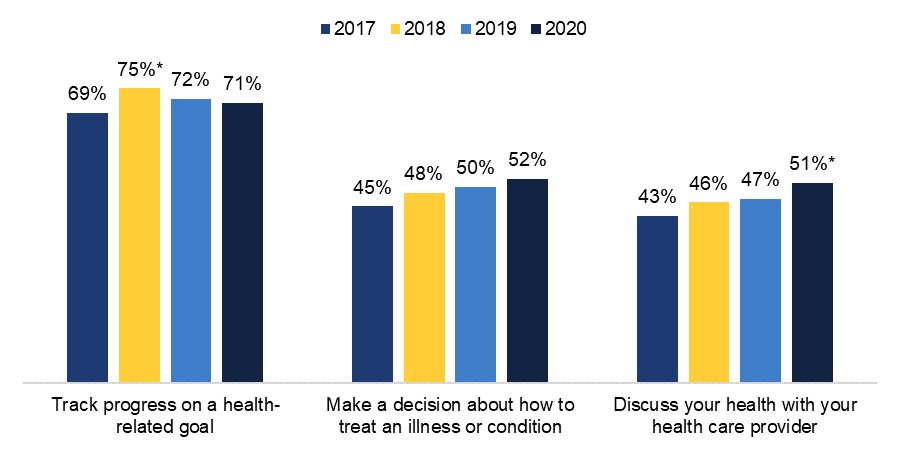
Figure 9: Percent of individuals who reported using their health and wellness app to help discuss, track, and/or make decisions regarding their health, 2017-2020.
Source: HINTS 5, Cycles 1-4 (2017-2020)
Notes: *Significantly different from 2017 (p<0.05). Denominator is among those with a mobile health app on their tablet or smartphone.
Summary
Individuals’ rates of being offered and subsequently accessing their patient portal increased significantly between 2018 and 2019, but did not change in 2020. About 6 in 10 individuals nationwide were offered access to their patient portal by a health care provider or insurer, and nearly 4 in 10 individuals (38 percent) reported that they accessed their portal at least once in 2020.
Consistent with past trends, individuals who did not access their patient portal most commonly cited their preference to communicate directly with their health care provider and lack of need as reasons for not accessing their record (3-5). However, individuals who were encouraged by their health care provider to use their patient portal reported significantly higher rates of accessing their portal, viewing clinical notes, and exchanging secure messages with their provider compared to those who were not encouraged (5-6). This illustrates the influence providers have with respect to educating patients about the benefits of having access and the value proposition for doing so. ONC’s Patient Engagement Playbook and Guide to Getting and Using your Health Record are resources for providers and patients, respectively, to learn about the benefits of patients having access to their health records and offer tips for how to request access.
Patient portals enabled individuals to electronically communicate with their providers, view their clinical notes, and electronically share their health information with a health care provider. In 2020, about 6 in 10 patient portal users reported exchanging secure messages with a health care provider through their portal. Half of portal users reported viewing clinical notes written by a health care provider. The share of individuals who electronically shared their health information with a healthcare provider increased by seven percentage points (from 10 percent to 17 percent) from 2017. However, rates of individuals electronically transmitting their data to an app or service remains low (5 percent).
Various methods for accessing patient portals have emerged in recent years. While the most common method of accessing a patient portal was by computer (78 percent), nearly 4 in 10 patient portal users accessed their portal using a smartphone health app in 2020. Additionally, portal users who accessed their health information using both a computer and a smartphone health app (22 percent) reported accessing their portal more frequently than those who only used one method. This may indicate that the increased convenience of having access to electronic health information on multiple devices leads to greater use.
Americans also reported using mobile health apps more broadly to manage their health and make decisions about their care. Half of individuals nationwide had a mobile health app on their tablet or smartphone, and more than 80 percent said they used the app within the past year. In 2020, about 7 in 10 individuals with a health app reported they used it to track progress on a health-related goal, and about half reported that they used their app to facilitate discussions with their health care provider and to make treatment decisions.
Making it easier for individuals to access and use their electronic health information is a national priority. The ONC Cures Act Final Rule seeks to make health information from electronic health records more easily accessible to patients through secure, standards-based APIs that can be leveraged to create applications that can help patients manage their health information. Ultimately, ONC hopes these provisions will enable patients to more easily access and use their health information across patient portals offered by different health care providers. Examining how these trends evolve over time will provide insight regarding the extent to which this vision is realized.
Data Source and Methods
Data are from the National Cancer Institute’s (NCI) Health Information National Trends Survey (HINTS). Since 2003, NCI has sponsored HINTS to assess the impacts of health communication, specifically measuring: how people access and use health information, how people use information technology to manage their health and health information, and the degree to which people are engaged in health behaviors.
ONC staff, working with the National Partnership of Women and Families and NCI, developed the survey content related to health IT use for HINTS 5. HINTS 5, Cycle 4 (2020) data were collected from the end of February through the middle of June 2020. The sample design for HINTS 5, Cycle 4 (2020) consisted of a single-mode mail survey, using the Next Birthday Method for respondent selection.
The sample design for the HINTS 5, Cycle 4 (2020) survey consisted of two-stages. In the first stage, a stratified sample of addresses was selected from a file of residential addresses. In the second-stage, one adult was selected within each sampled household. The sampling frame consisted of a database of addresses used by Marketing Systems Group (MSG) to provide a random sample of addresses. Complete data were collected from 3,865 respondents. The final response rate was 37%. Results were weighted to account for non-response and generate national estimates.
The analyses conducted in this data brief primarily focused on questions from sections B and D. The questions asked in the HINTS 5, Cycle 4 (2020) survey can be found at https://hints.cancer.gov/docs/Instruments/HINTS5_Cycle4_AnnotatedInstrumentEnglish.pdf.
References
1) Office of the National Coordinator for Health IT. ONC Cures Act Final Rule. https://www.healthit.gov/sites/default/files/nprm/ONCCuresNPRMMoC.pdf
2) 21st Century Cures Act, section 4006. https://www.gpo.gov/fdsys/pkg/PLAW-114publ255/pdf/PLAW-114publ255.pdf
3) Johnson C, Krakow M, Patel V. (January 2019). Trends in Individuals’ Access and Use of Online Medical Records and Technology for Health Needs: 2017-2018. ONC Data Brief, no.50. Office of the National Coordinator for Health Information Technology: Washington DC.
4) Patel V & Johnson C. (April 2018). Individuals’ use of online medical records and technology for health needs. ONC Data Brief, no.40. Office of the National Coordinator for Health Information Technology: Washington DC.
5) Patel V & Johnson C. (May 2019). Trends in Individuals’ Access and Use of Online Medical Records and Technology for Health Needs: 2017-2018. ONC Data Brief, no.48 Office of the National Coordinator for Health Information Technology: Washington DC.
6) Shimoga SV & Lu YZ. (March 2019). Role of provider encouragement on patient engagement via online portals. Journal of the American Medical Informatics Association, Volume 26, Issue 10.
References
The authors are with the Office of Technology, within the Office of the National Coordinator for Health Information Technology. The data brief was drafted under the direction of Mera Choi, Director of Technical Strategy and Analysis (TSA), and Talisha Searcy, Deputy Director of TSA.
Suggested Citation
Johnson C, Richwine C, & Patel V. (September 2021). Individuals’ Access and Use of Patient Portals and Smartphone Health Apps, 2020. ONC Data Brief, no.57. Office of the National Coordinator for Health Information Technology: Washington DC.